
Do you have more financial assets than your average Belgian? If you’re not from Switzerland or the United States of America, chances are you don’t! A recent Allianz study showed that Belgium is the third ranking country when comparing average net worth per capita, which reinforces the belief that Belgians are quite the savers.
The numbers

In Belgium the average household savings last year hovered around 2,130 Euros. As such, only Norway and Sweden saved more on a global scale. This outcome is no surprise to most Belgians, who have, in general, since long adopted home ownership and savings accounts as a new religion.
As a result, the average net worth of a Belgian citizen is €78,302. The Swiss, however, take the crown by having financial assets worth over €146,540, which is almost twice as much. US citizens own €119,565 and come in second place as a result. The table below provides an overview of most European and developed nations worldwide.
| Country | Net financial assets (per capita) | GDP (per capita) |
|---|---|---|
| Austria | 43,739 | 36,806 |
| Belgium | 78,302 | 34,347 |
| Denmark | 53,379 | 44,340 |
| Finland | 20,935 | 35,649 |
| France | 46,016 | 32,030 |
| Germany | 44,283 | 33,923 |
| Greece | 14,603 | 16,360 |
| Ireland | 34,303 | 35,536 |
| Italy | 48,797 | 25,578 |
| Netherlands | 71,434 | 35,941 |
| Norway | 11,851 | 71,250 |
| Poland | 5,954 | 10,269 |
| Portugal | 22,484 | 15,611 |
| Spain | 21,989 | 21,800 |
| Sweden | 70,079 | 42,907 |
| Switzerland | 146,540 | 60,937 |
| United Kingdom | 63,488 | 30,856 |
| Australia | 43,739 | 43,234 |
| Canada | 65,897 | 36,489 |
| Japan | 71,191 | 25,978 |
| United States of America | 119,565 | 38,088 |
| World | 17,678 | 9,924 |
When looking at my latest net worth, I’m about the same as most – I was so confused by the difference when I was a child – Australians and Austrians, the French, and your average German. I know, fellow Belgians, I’m letting you down by dragging our average net worth down, but give me another year or two and I will have joined your ranks!
On a global level, households are now worth over 118,000 billion Euros in total, up from last year by 9.9%. Most of that gain is the result of excellent stock market performance in most of the developed countries. The fastest growth occurs in Eastern Europe, Latin America and Asia, as the chart below shows.
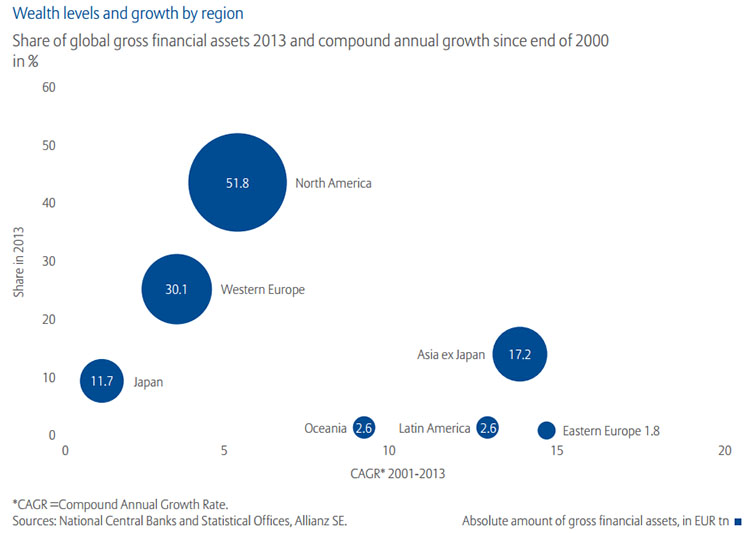
What’s interesting is that this chart goes back to the end of 2000. As a result, it starts right behind the dot-com bubble and contains the 2008 financial and economic crisis. Even though the stock markets lost 50% of their value in one year, the compound annual growth rate is still above 4% for Western Europe and about 5% for North America.
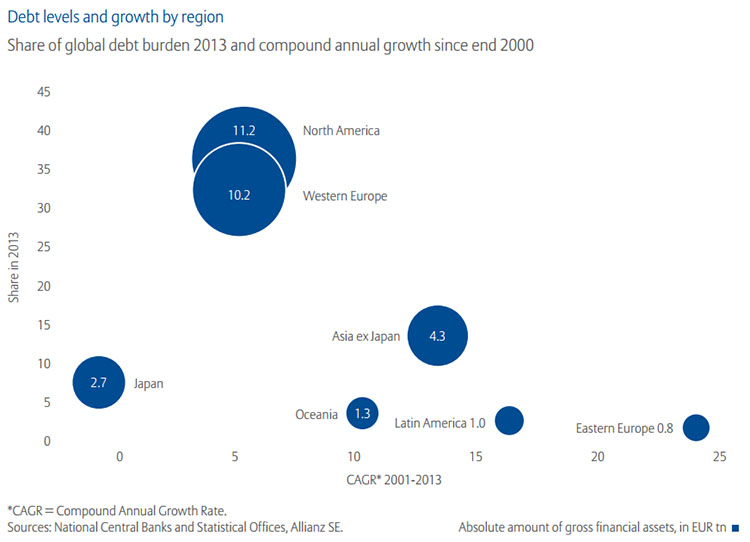
The 2008 recession did impact debt levels and growth, as shown below. Western Europe and North America account for about 70% of all global household debts all by themselves. Except for Japan, both Western Europe and North America also have the lowest debt growth of all regions. Eastern Europe, for example, has been growing its debt annually by almost 25%.
The meaning
Statistics like these are fun, but in and of themselves quite useless. It’s only when we interpret them that they hold value. So what does all of the above actually mean, apart from the fact that Belgians are totally awesome money-saving bad asses badasses?
First of all, the reported statistics are all averages, which means we should take them with a grain of salt. If ten people have only €1, but one person has €100, the average net worth is €10, even though almost everyone owns only 10% of that average. As such, I fear that the USA household net worth is slightly skewed because of its high income and wealth inequalities. The GDP numbers seem to confirm this theory.
The same might be said for Belgium because it has seen quite a large influx of mega-rich Frenchies like Bernard Arnault, the CEO of Luis Vuitton Moët Hennessy. We do, however, have excellent wealth redistributing mechanisms in place and we are one of the most equal countries worldwide when it comes to income. Switzerland is a special case all by itself, of course.
Second, even with the financial, economic, and sovereign debt crises, the end of the average household net worth trend line points firmly upwards. 4% to 5% compound annual growth is excellent, even though some economic indicators have been blinking red for a long time now. I’d sign up for a guaranteed 5% compound annual growth rate any day of the week.
Third, most of the gains come from the stock market. The report also showed that most Belgians left a lot of money on the table by relying on low interest savings accounts. That’s why it’s a good idea to invest in index funds. Over the long term equities will boost your net worth much higher than other financial assets.
Fourth, the reason why savings accounts aren’t a good way to store your savings long-term is because inflation is still a saver’s worst enemy. Even though inflation levels are at an all time low in Europe, most people see their net worth evaporate by not investing their savings properly. In total this cost all Belgians about 6 billion Euros over the past fourteen years.
Fifth, it appears that debt is an integral part of our lives. This should come as no surprise considering most people take out a mortgage to buy their first house or considering that most businesses use debt to grow and expand. However, when your debt grows at a compound annual growth rate of over 20%, you’re doing something wrong – I’m looking at you Eastern Europe. Debt should be used carefully and responsibly, not to fuel extravagant lifestyles.
So, how do you stack up against those beer-drinking and chocolate-and-waffle-munching Belgians?
Good post, NMW–
“Fifth, it appears that debt is an integral part of our lives. This should come as no surprise considering most people take out a mortgage to buy their first house or considering that most businesses use debt to grow and expand.”
I think that this is a good point. Some folks in the FI community are strongly anti-debt, and while I agree with the idea that debt increases risk and is generally undesirable, there are many times when I feel that debt is the right option.
Of course, there’s a heck of a big difference between:
1) a tax-deductible 4% mortgage that allows you leverage on the purchase of an appreciating asset,
2) a 1-2% loan on a REASONABLY PRICED car that allows you to pay down your 4% mortgage or invest in 3-4% paying dividend stocks with your capital,
3) credit card based consumer debt costing you 18% a year on luxury goods or expensive dinners (or waffles!) you probably didn’t need in the first place.
Guess which one I DON’T think is a good idea 😉
Excellent addition, Charles!
That’s exactly what I meant. For myself the only type of debt that is acceptable is a mortgage on a house or on a rental property. I can understand why you would want to finance your car at a low interest rate, but I’m not a big fan of going into debt for fast depreciating items.
Buying luxury goods on credit is absolutely a no-go and probably a sign you’re living above your paycheck.
Thanks for stopping by,
NMW
Interesting post, Waffles. The swiss are really leading the list of savers.
Charles – I agree with you about the difference in cost of debt. It used to be that student loans were also in the category of “reasonable”, but now with interest at 7-8% on even federal loans it is really taking a toll on the US economy. Are student loans expensive in Belgium and other parts of the world?
I’m not sure about the Swiss and USA though. Switzerland has been a tax haven for superrich famillies for centuries and wealth in the USA is very unevenly distributed, which may skew the outcome of this study significantly, as explained in the first point above. Considering USA households only save about 4% of their paycheck it seems unlikely that they amass such a high number of wealth.
The Belgian numbers above seem more reasonable considering we have over €250 billion in savings accounts for only 11 million people and almost everyone owns rather than rents a home (average house price around €200,000).
Maybe it has something to do with pension schemes? I’m not too sure they’re counted towards these numbers and couldn’t find anything in the study about them.
7-8% on student loans, whoa! That’s a crippling number for someone who’s not yet earning a steady income! I haven’t met anyone in Belgium who had to take out a student loan to go to university. To sign-up you pay €600 at most, with lower prices for lower income students. I did a post in this in the past, if you’re interested: http://www.nomorewaffles.com/2014/07/my-head-start-the-belgian-education-system/
I’ll start calling you Waffles, as well. Waffles, it appears my net worth is higher than the average net worth of people from every country listed. Super weird to think that.
I’ll allow it. 🙂
Congrats! That’s probably because you save like a badass, my friend. It would be fun to find a study that looks at the correlation between age group and wealth percentile in each country. I think you would rank somewhere near the absolute top of that list.
NMW,
Do the averages take into account the really super rich as well as the extremes of poverty. I sometimes think that the numbers become scewed somewhat because there are quite a few extremely rich individuals that could push the numbers higher. If the extremes of wealth were eliminated or the median income and net worth were considered also, we might get an even clearer picture of where each person fits.
Robert the DividendDreamer
Skewed is what I meant. I was typing on a phone while talking to my kids.
Later,
Robert the DividendDreamer
Robert,
You’re right about the problematic usage of average wealth. I addressed this in the first point under the header “the meaning”. A lot of rich or a lot of poor people can really skew the results.
In the end, statistics can be interpreted any way you want.
Cheers,
NMW
I must have really been in another world because I skipped that paragraph yesterday. That is exactly what I was asking. Thanks for pointing that out. My kids had the football team and all the brothers and sisters over yesterday and I was being hit from all angles when I was reading. If it was a snake it would have bit me.
Keep cranking,
Robert the DividendDreamer
No problem, happens to me too!
Sounds like you had a crazy saturday afternoon! 😀
Look at those smug North Americans and their big income and debt bubbles lording over all on those graphs 😛
On a serious note, interesting statistics on global wealth levels. I do love me data and statistics 😀
Haha, pretty amazing that only 350-400 million people (6% of world total) have over 40% of the global debt number. I found this study to be very enlightening!
Go forth and make awesome graphs, Steve, I know you want to!
Very interesting statistics on global wealth levels. It’s interesting to see that Poland has such low numbers.
Interesting, but nog very surprising, I think. They have been under socialist influence for a very long time and only recently has their economy been starting to pick up after earlier reforms. If I’m not mistaken, Poland still is a mostly aggriculture-based economy, which is why their GDP is so low.
Hi Waffles,
It seems that I’m pushing the average a little higher for my fellow Belgians. But I think persons like Albert Frere and the like push the average higher
Have a good sunday
Cheers,
Geblin
Congrats, Geblin! You are definitely one of the more financially savvy Belgians out there!
People like Albert Frere certainly push the average higher, but in general the number of truly rich people in Belgium is rather limited. Recently I read a report that stated Belgium was one of the countries with the most equal wealth distrubition in all of Europe.
You can prove anything through statistics though, so these numbers don’t mean too much in the grand scheme of things.
Enjoy your sunday too,
NMW
NMW,
Nice article!
My guess is that the truth might be even more shocking if you take into account all the wealth hidden in companies owned by one person or a family. A lot of bvba’s out there only function as a wealth-stealth mechanism just to avoid taxes.
Financial Red Devil
You are probably right, but it would be a near impossible task to take them on in this study. I think the West is probably a lot richer than most studies and numbers suggest!
Cheers,
NMW
I’m surprised the US is rank so high. Everyone I know complains about how broke they are. But I do have to admit, we do live pretty well over here. =D
Well, one Bill Gates makes up for over 500,000 people who have a net worth of zero to get to an average net worth of $120,000, so maybe that’s why the US still ranks near the top! 🙂
Waffles ~ remember I called you that first ;-), it’s all relative really and when you get into the big broad groups like this it all becomes really meaningless doesn’t it. For instance, I’m sure you are top top for your age group in savings, however you perceive you are pulling down the Belgian number, but actually you are not if you look at your demographic. Take me for instance, I don’t want to compare to the top 1%, nor do I want to compare to those in poverty (though I have much compassion), nor do I want to compare to people who have many years left to save for retirement. So even though I see numbers that make me look pretty good in some ways, I know the truth is somewhere else. I don’t even know whether I’m doing better or worse for people my age but I suspect I’m middle of the road. Not trying to bash you for sharing this info, it’s all relevant and whets ones appetite more to dig deeper.
Debs,
Thanks for your extensive reply, I appreciate it. I’m sorry if you perceived this post to be too serieus, that was not my intention. The title does clearly point to an upcoming comparison, but that’s not the main goal of this post.
I’ve tried to make that clear in the “The meaning” paragraph in the very fist sentence, but maybe that wasn’t clear enough! You can truly prove anything with data and statistics. I tried to explain some general conclusions, but a one on one comparison of countries or people is definitely out of the question using this study. If you check out the OECD website they actually found a completely different outcome!
Also, you are totally right for not comparing yourself too much to other people. Everyone is different, comes from different backgrounds, and had a different life, so it’s useless to say you did better or worse than someone else.
What I’m trying to say is, studies like the one mentioned above are fun because they show overall trends. I like to share them so people can go through them. What’s apparent from this study, for example, is that debt is truly integral to our lifestyles, but that doesn’t mean you can use that information to compare yourself directly to others.
Again, thank you for taking the time to reply. You raised some good points I’ll try to bring out more in my future posts.
Best wishes,
NMW
PS: you sure did call me Waffles first! Better file a trademark ASAP! 😀
hee hee yes, and this reminds me of this quote “There are three types of lies — lies, damn lies, and statistics.”
― Benjamin Disraeli
Interesting article! I know I experience the same thing as Henry @ Living at Home does, where most of my coworkers complain about their debt and bills. So I wonder if Americans’ average net worth is heavily increased by home equity (while their liquid assets are very small), or if the richest people are skewing that number up. Based on what I’ve seen about wealth inequality in America, the latter at least is true.
DD,
Interesting point of view about the home equity. That certainly is true for Belgium: really expensive housing market and almost everyone owns a house). The much reported income and wealth inequality in the US will certainly have something to do with the average too. It’s one of the only countries on the list where the average net worth is over three times the GDP per capita.
Thanks for stopping by once more,
NMW
This is an interesting study. I’m not used to seeing these figures on a per capita basis. I’m thinking that to know where I stand I’d have to give my kid a share of our family net worth too?
Per capita literally means per person, so your child has the same average net worth as everyone else. The numbers above are the total amount of wealth in a country divided by its number of inhabitants.
Don’t take these numbers as a golden standard of must-have net worth, because they are just averages, like discussed in the comments above. One really rich person could significantly bump up the average while the rest of the country remains poor.
Thanks for stopping by,
NMW
Looks like we Canadians need to stop buying new hockey sticks and start putting some money away!
Haha, best joke I’ve heard all week! 😀 Spread the message over there and we’ll see how Canada did next year!
Oh the Swiss! I really enjoyed the statistics in this post and am feeling pretty good about where I stand according to this table. I do agree that the Americans’ net worth is probably a reflection of housing equity.
Glad you liked it, Michelle! Way to go on your net worth! 🙂
Too bad the study didn’t include any other demographic statistics like age groups. I think that would give these numbers a completely different mening.